
How to Use the Best Free Candlestick Charts for Calmer, Smarter Trading
What Are Candlestick Charts
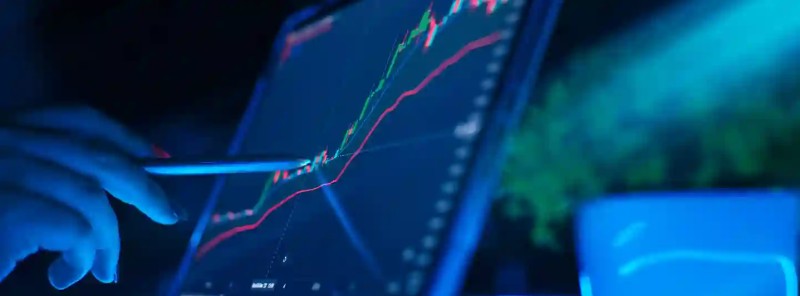
Candlestick charts arrived from Japan in the 1700s. They show price across a set window of time. You see the open, high, low, and close. The body is the space between open and close. The wicks mark the high and the low. I use these to read price action fast. The business definition of trading often starts with this kind of visual read.
The best free candlestick charts give you this same view at no cost. You don’t need fancy software. A simple chart with clear candles helps you spot turning points. A long upper wick means buyers pushed up but sellers won. A long lower wick means sellers pushed down but buyers came back.
Eight Bearish Patterns I Watch
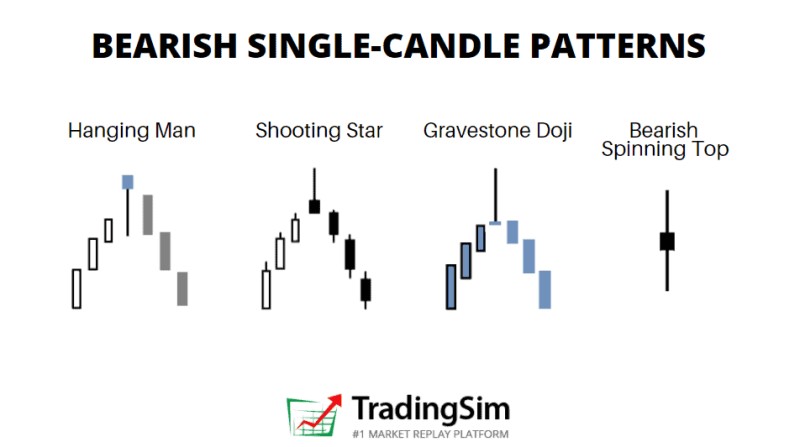
Bearish patterns hint that price may be about to fall. They work best at the top of an uptrend or near a major resistance. They need above-average volume. And they need a follow-through close to confirm the move. I keep a short list of eight that have proven reliable for my day trades.
Eight reliable bearish patterns to know
- Bearish Engulfing - the most reliable single-bar reversal; needs a prior uptrend of five sessions.
- Shooting Star - long upper wick twice the body, small body at bottom, closes near the low.
- Evening Star - three candles: long green, small body, long red closing below the midpoint of the first.
- Three Black Crows - three red candles, each opens inside the prior body, closes near the low.
- Hanging Man - bearish at the top, long lower wick, closes near the high but below the prior high.
- Dark Cloud Cover - red opens above prior high, closes more than half into the green body.
- Bearish Harami - second body inside the first body, signals exhaustion.
- Gravestone Doji - open and close near the low, long upper wick, tiny body.
Without volume, the pattern is just noise.
Bearish Engulfing Pattern
This is the most reliable single-bar reversal signal. It needs a prior uptrend of at least five sessions to count. The red candle must fully cover the green candle before it. I like this one because it is clear. With confirmation, the win rate is 64 percent; standing alone, it is only 46 percent.
For entry, aggressive traders may step in as the candle forms when supply appears. By-the-book traders wait for a new low to confirm, then enter on the next candle. The stop goes above the candle high or within the body. The target uses the size of the engulfing range.
Shooting Star Pattern
A shooting star has a long upper wick about two times the body. The body is small and sits at the bottom of the range. It closes near the low. This shows buyers tried to push up but failed. With confirmation, the win rate is 59 percent.
You can enter aggressively as the star forms. Or wait for the close and place the stop at the star high. Some enter on the second candle that closes below the star low. That is the confirmation I prefer.
Evening Star Pattern
This is a three-candle pattern. First a long green, then a small body of any color, then a long red that closes below the midpoint of the first candle. It shows a shift from buying to selling. Confirmed win rate is 65 percent.
Enter on confirmation of the breakdown with the long bearish candle. Stop above the doji high. Risk is set to the recent swing high. I watch for this at major resistance.
Three Black Crows Pattern
Three black crows are three red candles in a row. Each opens within the prior body and closes near the low. This pattern has the highest win rate at about 70 percent with confirmation. But it is rare and often late.
Enter on the third crow close or on a pullback if the trend is strong. Stop above the third crow high. Be careful - it may already be far into the move.
Hanging Man Pattern
The hanging man shows up at the top of an uptrend. It has a long lower wick, body small or medium, closes near the high but below prior high. It means selling pressure appeared. Win rate is about 55 percent with confirmation, weaker alone.
Look for a strong prior uptrend. Enter on the next candle that closes lower or on a breakdown of the low. Stop above the hanging man high. It works better with a bearish engulfing nearby.
Dark Cloud Cover Pattern
Dark cloud cover is a bearish reversal after a green candle. The red candle opens above the prior high and closes more than halfway into the green body. It shows sellers took control. Confirmed win rate is 60 percent.
Enter as the red candle breaks below the prior green close. Stop above the dark cloud cover high. Simple and works well when volume is there.
Bearish Harami Pattern
Bearish harami has a second candle body completely inside the first candle body. It signals exhaustion, not a strong trigger. Win rate is 56 percent; treat it as a warning.
Use it as a warning sign. Consider a short after it completes, preferably on higher volume. Stop above the harami high. I don’t trade it alone.
Gravestone Doji Pattern
Gravestone doji opens and closes near the low with a long upper wick and tiny body. It indicates rejection of higher levels. Confirmed win rate is 58 percent.
Look for a prior rise. Entry on a follow-through close below the doji low. Stop above the gravestone high. It’s a clear sign buyers gave up at the top.
Why Volume Matters
Don’t skip this part. Every reliable bearish reversal pattern prints on volume at least 1.5 times the prior 10-session average. Without that volume, institutions aren’t distributing - you’re just watching algo noise. Relative volume of 2.0 or more is high conviction.
I check volume before any short. The best free candlestick charts let you add volume bars easily. If volume is low, I step back.
Three Checks Before I Trade
I run three checks before I take a bearish setup: location, volume, and follow-through. Miss one, and the odds drop fast.
Three critical checks
- Location - only at the top of an uptrend or major resistance; a 20-period MA can act as a reject level.
- Volume - relative volume 1.5x or higher, 2.0x is high conviction threshold.
- Follow through - wait for pattern candle to close, then one more candle confirms.
- Broad market - check SPY or QQQ so you don’t short against the trend.
Patterns without follow-through fail above 60% of the time.
Follow-through matters. A shooting star printed on Tuesday is only a short if Wednesday opens below Tuesday’s close. With follow-through, the fail rate drops to around 30 percent. That’s a big edge.
Free Charting Platforms I Like
You don’t need to pay for good charts. The best free candlestick charts come from a handful of platforms. Some have paid plans, but the free tier is enough for reading price action.
Platforms that show free candlestick charts
- Koyfin - free tier has global equities, ETFs, FX, futures, macro data, modern charting.
- TradingView - free charts, unlimited, hundreds of indicators, drawing tools, Pine Script.
- StockCharts - free SharpCharts, classic technical analysis, many chart types.
- Yahoo Finance - completely free, basic line bar and candle charts for stocks ETFs funds.
- Finviz - free site with quotes, basic chart displays, strong stock screener.
- StockRover - paid only, no free tier, fundamental focus but shows candles.
- TrendSpider - paid platform with automated pattern recognition, no free tier.
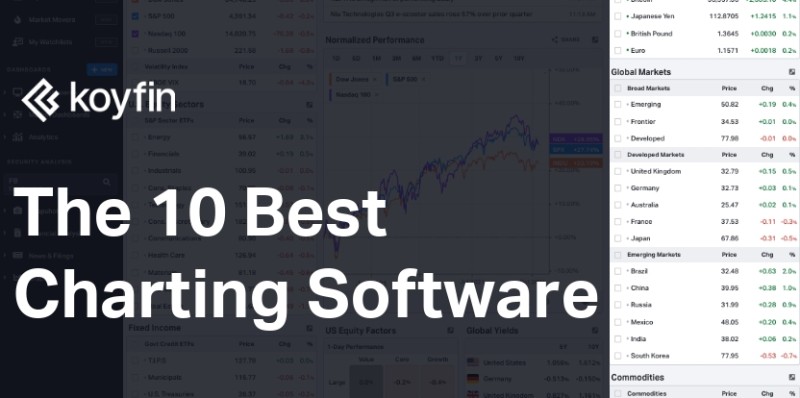
Koyfin’s free tier lets you overlay fundamentals like P/E on charts. That helps confirm a bearish pattern against weak earnings. TradingView free is my daily driver for buy and sell signals on TradingView using built-in scripts.
TradingView Free Charts
TradingView offers free charting with unlimited charts. You get many technical indicators and drawing tools. It covers stocks, crypto, forex, and futures. The free plan is solid for most people.

You can use Pine Script to build custom studies. Pattern scanners highlight bearish reversals for you. This cuts manual work. I still check volume myself.
Yahoo Finance and Finviz for Quick Checks
Yahoo Finance is completely free and good for a fast price check. You get simple MA and RSI overlays. Finviz has a powerful screener to find stocks with bearish candles. Both show candlestick charts without a login.
For crypto, the best crypto trading sites often have their own charts. But you can also pull crypto on TradingView free - that keeps you in one place.
Raindrop Charts vs Candles
Raindrop charts are newer. They embed volume information inside each bar. The left side is the first-half VWAP, the right side the second half. You see sentiment shift without a separate volume pane.
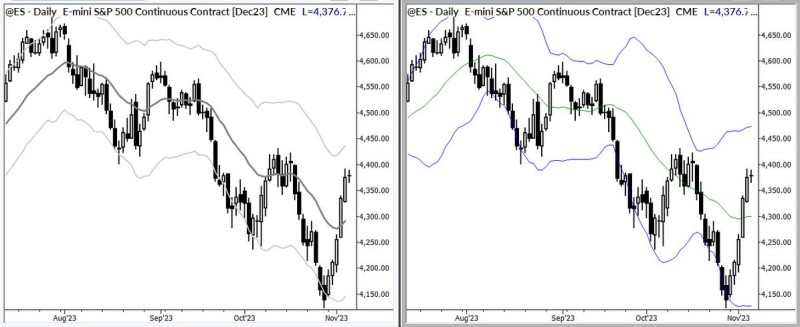
They filter noise because volume is encoded. A blue doji raindrop means equilibrium. Bearish engulfing appears in both styles, but the raindrop gives earlier confirmation. I still like candles for a simple read, though.
Using Crypto Platforms for Charts
Many traders ask about crypto. The popular platforms for crypto trading include ones with free charts. You can do day trading on Coinbase and see candles there. Day trading on Kraken also gives chart views. For a broader list of crypto trading platforms you can check review sites. I look at the best platforms for crypto trading for low fees and good chart tools.
If you use MetaTrader, the broker to use for MetaTrader 5 matters for the data feed. And some folks get futures signals on Telegram for alerts. But I still read the candle myself before entry.
Common Trading Mistakes
I see the same errors repeat. Shorting against the main trend is a bad idea. Ignoring earnings can burn you. News catalysts flip setups. No hard stop is suicide. Holding a short squeeze ruins accounts.
Mistakes I see
- Shorting against the market trend - always check SPY or QQQ first.
- Ignoring earnings - a stock can gap up 20 percent overnight.
- Ignoring news catalysts that invalidate the pattern.
- Not setting a hard stop - fastest way to a margin call.
- Holding through a short squeeze - cover into strength instead.
Shorting without a stop is the fastest way to a margin call.
Risk and Position Size
Risk control is key. For a short on a bearish pattern, place the stop above the recent swing high or the pattern wick. The target uses the pattern range size, extended 1 to 1.5 times for a trail.
Risk rules I follow
- Stop placement above swing high or upper wick of the pattern.
- Profit targets based on pattern range size.
- Position size fixed 1 to 2 percent account per trade by stop distance.
- Check earnings calendar before any short entry.
Keep it calm. A small loss is fine. A huge loss from no stop is not.
Reading Intraday Patterns
Intraday traders use a few more cues. A doji shows indecision. An engulfing is a strong reversal. A hammer is bullish at the bottom. A shooting star is bearish at the top. An inside bar is consolidation. An outside bar is a strong move.
Key intraday patterns
- Doji - tiny body, long wick, signals indecision.
- Engulfing - second candle engulfs prior body, strong reversal.
- Hammer - small body near high, long lower wick, bullish bottom.
- Shooting Star - small body near low, long upper wick, bearish top.
- Inside Bar - narrow candle inside prior range, consolidation.
- Outside Bar - candle engulfs prior range, strong directional move.
Combine these with support and resistance, moving averages, and volume. Confirmation from RSI or MACD helps. The best free candlestick charts let you add those easily.
Combine Price Action with Fundamentals
Free platforms like Koyfin let you put fundamentals on the chart - P/E, revenue growth, margins. If a bearish candle matches falling earnings, the odds of a downtrend go up.
I do this for stocks. For crypto, you look at network stats or news. The point is to back the pattern with more than price alone. It cuts false signals.




Comments on “How to Use the Best Free Candlestick Charts for Calmer, Smarter Trading”
No comments yet. Be the first to share your thoughts.